Understand EV DC fast-charging curves, peak kW versus sustained power, state of charge, temperature and practical road-trip charging time.
What does an EV charging curve show?
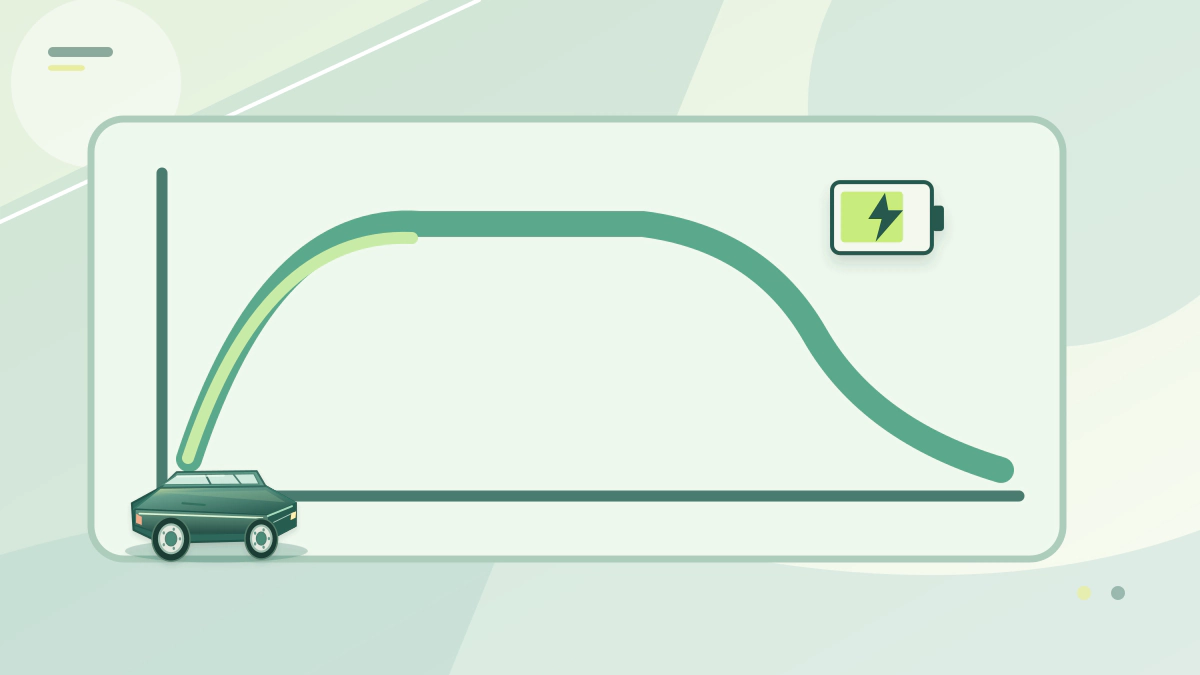
An EV charging curve plots the power entering a battery over a charging session or as its state of charge changes. It explains why a vehicle advertised with a high peak DC fast-charging rate may sustain that rate only briefly and why filling the last part of a battery can take disproportionately longer.
Charging power is measured in kilowatts (kW), while the energy added is measured in kilowatt-hours (kWh).
For useful charging-time comparisons, look for the whole curve and the tested start/end charge percentages rather than a single headline power number.
Understand the typical phases
| Phase | What may happen | Why it matters |
|---|---|---|
| Early session | Power ramps up after communication and checks | Advertised peak may not appear instantly |
| Low-to-middle battery charge | Many batteries can accept higher power | Often the quickest energy-gain portion |
| Higher state of charge | Vehicle may reduce charging power | Added range per minute decreases |
| Near full | Charging may taper further | Waiting can be less time-efficient |
The DOE training presentation explains that vehicle hardware, state of charge, chemistry and temperatures all affect charging speed. Individual vehicles have different curve shapes, so the table is conceptual rather than a measured profile for any particular model.
Why the peak number is misleading
Imagine two hypothetical EVs.
One briefly reaches a very high peak before sharply reducing power, while another holds a lower peak for longer.
Over the same usable charge window, the second could add comparable—or even more—energy.
Without curve data or measured elapsed charging time, the peak rate cannot rank their performance.
The station’s maximum power also matters. A car rated for high DC charging will not achieve its own peak at a lower-capacity station, or when connector, station, power-sharing or temperature limits intervene.
Reading a curve with simple arithmetic
Energy equals power multiplied by time. A curve lets you add up its segments.
This is a hypothetical illustration, not a measured vehicle. Assume an 80-kWh usable battery and these average powers.
| Segment | Energy added | Assumed average power | Time |
|---|---|---|---|
| 10% to 40% | 24 kWh | 120 kW | 12 minutes |
| 40% to 70% | 24 kWh | 80 kW | 18 minutes |
| 70% to 90% | 16 kWh | 40 kW | 24 minutes |
The session adds 64 kWh in 54 minutes. That is an average of about 71 kW.
The final 20 points took 24 of those 54 minutes. A flat 120 kW would predict only about 32 minutes for the same 64 kWh.
This ignores charging losses and the early ramp-up, so real sessions differ.
Five things that change your charging session
- Starting state of charge: Charging often differs at 10% and at 80%.
- Battery temperature: Some vehicles condition the battery when navigating to a charger.
- Station capabilities: Available current, voltage and shared capacity vary.
- Battery and vehicle controls: The automaker’s protection and charging design sets limits.
- Weather and ancillary loads: Heating or cooling can affect how power is distributed.
Compare the entire measured time from one stated battery percentage to another. A common marketing window such as 10–80% is not interchangeable with 20–90%, nor are different battery sizes.
Why official time estimates cover wide ranges
Government pages give broad ranges for DC fast charging, because curves differ.
The AFDC consumer guide says DC fast charging adds 100 to 200+ miles in 30 minutes. The EPA charging basics page lists about 100 to 300+ miles per 30 minutes and notes that time may be shorter depending on station power.
The US DOT charger speeds page says DC fast charging can bring a battery-electric vehicle to 80% in 20 minutes to one hour.
EPA names the battery’s depletion, energy storage, battery type and temperature as factors in charging time.
Treat these as ranges, not a forecast for your car. Curves and limits differ by vehicle and temperature, so check the manufacturer’s data for your model.
How to plan a road-trip charging stop
Choose a charger compatible with the actual vehicle and verify its current status.
Arrive with a sensible range buffer.
Consider whether stopping charging earlier and driving to the next reliable station would be more efficient than waiting through a slow final charging segment. For choosing between an electric and a hybrid SUV for long drives, see electric SUV vs hybrid SUV for road trips.
The DOE EV consumer guide emphasizes charger compatibility, trip planning and real driving-range factors. Station uptime and actual power matter as much as the ideal factory charging curve.
Read why DC fast charging slows near full and Level 1, Level 2 and DC fast charging before comparing chargers.
Frequently asked questions
Does a 200-kW vehicle charge at 200 kW throughout the session?
Not normally. Peak kW is a maximum under appropriate conditions, not a continuous guarantee.
Is the charging curve identical every time?
No. Temperature, starting charge, station availability and battery conditions can change it.
Does the battery charge faster when empty?
Often the battery can accept higher power at a lower state of charge, but behavior depends on the exact vehicle and conditions.
Bottom line: Compare sustained charging and the full charging window, not a peak figure in isolation. For units, see kW versus kWh.