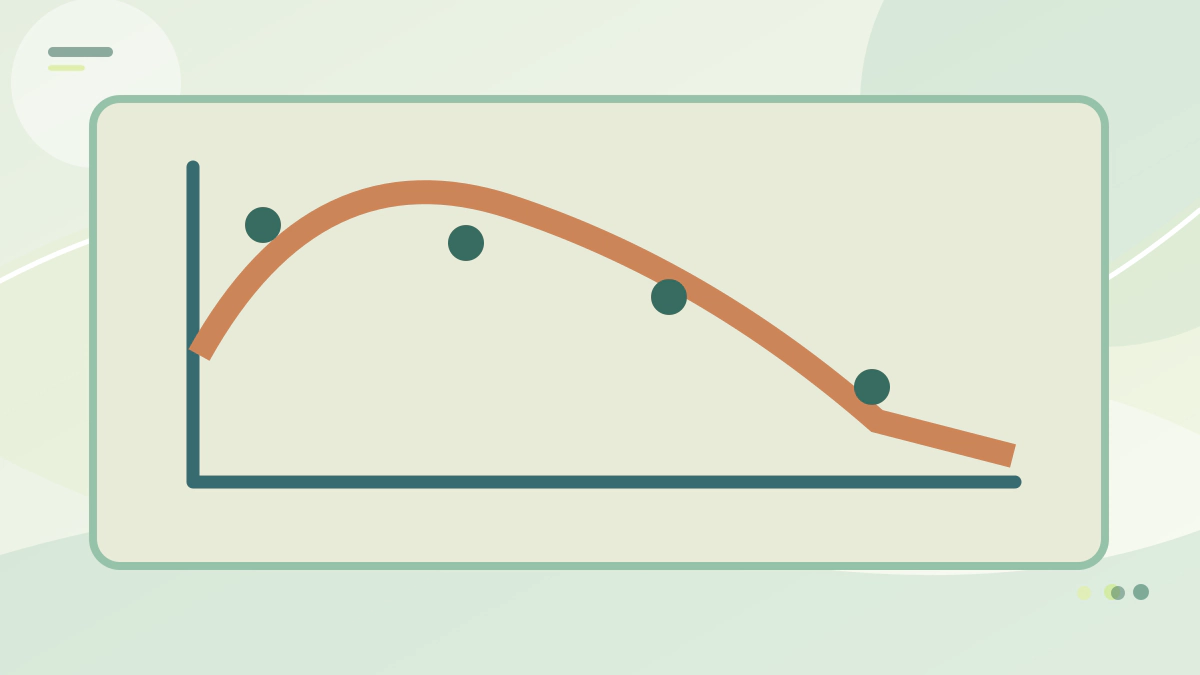
Peak DC charging power is a momentary maximum; the charging curve shows power over state of charge. Learn how to compare US-market vehicle specifications without misleading assumptions.
Peak DC charging power is a momentary maximum; the charging curve shows power over state of charge.
Some EVs reach a high number briefly, while others hold a moderate rate longer.
Thermal conditions and charging-station limits affect results.
This guide explains the measurement, where it matters in real ownership, and how to check claims for a specific US-market vehicle.
The figures that matter can differ by model year, trim, drivetrain, optional equipment and operating conditions.
The number behind the specification
A station marked 350 kW does not mean every connected vehicle can draw that rate; battery and dispenser limits still apply.
It helps to separate the defined measurement from the driver’s experience. A brochure number may have been obtained under controlled conditions, and real-world results can diverge when another variable changes.
Peak power alone does not establish which vehicle finishes a charging stop first.
Treat dramatic marketing statements as questions to investigate, not as evidence.
Where a manufacturer publishes several values, confirm which one applies to the exact equipment you are shopping for.
Why it matters when choosing a vehicle
Some EVs reach a high number briefly, while others hold a moderate rate longer.
Thermal conditions and charging-station limits affect results.
The most useful comparison starts with your actual driving: urban errands, highway trips, home charging, passengers, equipment or occasional heavy loads.
Consider how often you will use the advertised capability instead of choosing exclusively by the largest number.
A specification can interact with other constraints.
Three limits meet in one charging stop: the most the car will accept, the most the dispenser can supply, and whatever the battery’s state of charge allows at that moment. The lowest of the three sets the rate. A listing that quotes only one of them leaves the other two unknown.
Compare consistent 10–80% charging tests for the same model year and battery, including ambient and preconditioning conditions.
Ask a seller for the owner’s manual, vehicle label or current official technical sheet when a number is critical.
Do not substitute a generic model overview for the particular unit being inspected.
Compare the same conditions
| Claim in a listing | What it tells you | What it leaves out |
|---|---|---|
| Peak kW | The highest rate the vehicle can accept at one moment | How long that rate lasts |
| Minutes from 10% to 80% | Elapsed time across a stated window | Times for other windows or temperatures |
| Average kW | Energy added divided by session time | Which part of the session was fast |
| Charger rating in kW | What the dispenser can supply | What the vehicle will accept |
| Label kWh per 100 miles | Energy used to drive 100 miles | Anything about charging speed |
The EPA label for an EV does not settle this. FuelEconomy.gov explains that it shows consumption in kWh per 100 miles, an approximate driving range and a charge time based on 240-volt service. None of those items is a DC fast-charging rate, so the charging claim has to come from the manufacturer’s own documentation.
To compare fairly, record both vehicles’ values in the same units and check that each source describes the same test or definition.
If the data comes from different markets or model years, investigate before treating it as a direct comparison.
An independent test may be useful, but only where its methodology is stated.
A practical worked example
A station marked 350 kW does not mean every connected vehicle can draw that rate; battery and dispenser limits still apply.
Think about a buyer comparing two apparently similar versions of a vehicle.
Version A might list a larger figure, while Version B may meet the buyer’s requirements at lower cost or with more suitable equipment.
The right answer depends on more than ordering figures from highest to lowest. Why charging slows as the battery fills is explained in why DC fast charging slows near full.
Peak power alone does not establish which vehicle finishes a charging stop first.
Confirm which variable affects the result, which safety or use limitations remain, and what happens under less favorable conditions.
If a decision involves towing, loads, mechanical changes or safe driving, rely on official vehicle limits and qualified advice rather than an informal formula.
Before relying on an online listing
Compare consistent 10–80% charging tests for the same model year and battery, including ambient and preconditioning conditions. Save the exact specification sheet and note the date, market and model configuration. When inspecting a used vehicle, confirm its identity using vehicle documentation and check for recalls through NHTSA. Reviews can help explain driving impressions but do not replace vehicle-specific documentation.
A seller may quote the best-performing specification from a different trim.
If a number appears unusually attractive, ask whether it refers to a particular option, battery size, drivetrain, tire package or test condition.
Avoid relying on a claim that cannot be traced to an original source.
Common questions
Does a bigger number always mean a better vehicle?
No. Peak power alone does not establish which vehicle finishes a charging stop first. Suitability, safety limits and the full ownership picture are more important than maximizing one specification.
Can the figure change between model years?
Yes. Equipment, calibration, testing procedures and configuration can change. Verify the specification for the model year you are considering.
Are independent tests and official ratings interchangeable?
Not necessarily. Test protocols, surfaces, weather, driver inputs or measurement boundaries can vary. Compare like with like and preserve context.
What should I check next?
Compare consistent 10–80% charging tests for the same model year and battery, including ambient and preconditioning conditions. Keep a brief record of the source and any uncertainty before committing to a purchase.
Bottom line: Peak DC charging power is a momentary maximum; the charging curve shows power over state of charge. Use the number as a starting point, not a guarantee of your vehicle’s real-world performance.