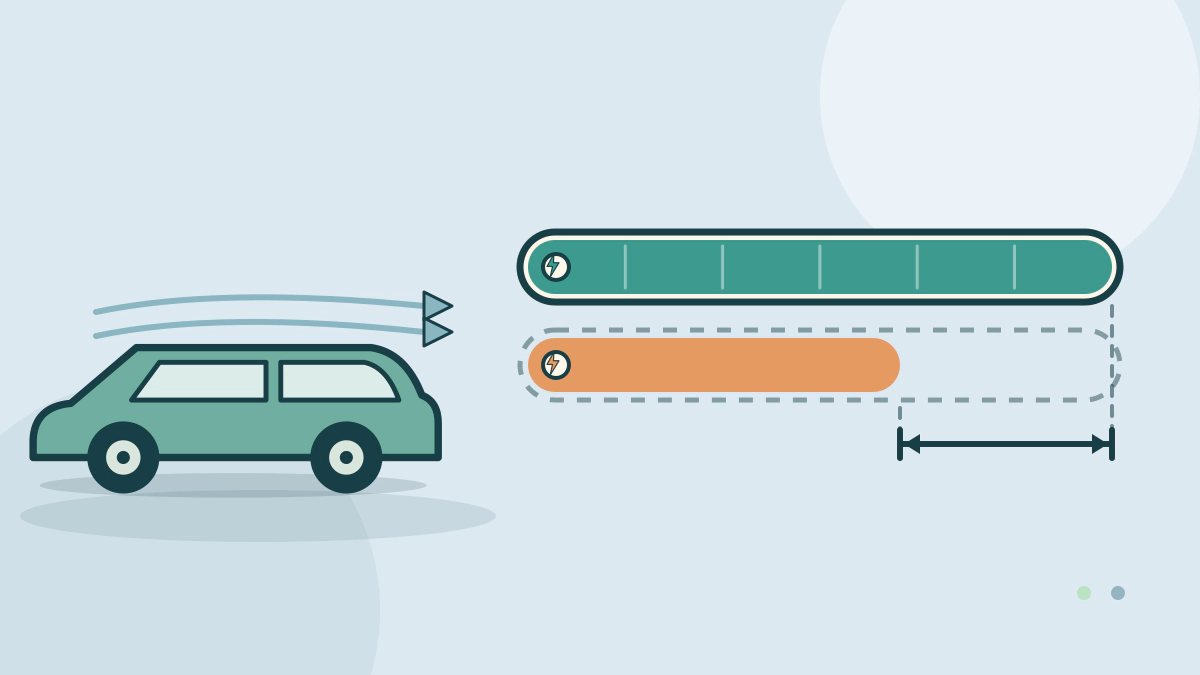
The EPA label range is a weighted city-highway figure, not a steady highway result. See the test speeds, the 0.7 adjustment and why 75 mph uses more.
Why is EPA range different from highway range?
The EPA label is a combined figure, not a steady highway measurement. It weights adjusted city and highway laboratory ranges at 55% city and 45% highway. A real interstate run differs because the highway cycle averages 48.3 mph, and the adjustment is a broad allowance rather than a route prediction.
The label combines two tests
EPA’s range testing page explains the procedure. A fully charged EV is driven over the city cycle until the battery cannot supply enough power to keep the required speed and acceleration. The distance is recorded. The test is repeated from a full charge on the highway cycle.
Automakers may use a single-cycle test, with repeated runs of the city or highway schedule, or a multi-cycle test with four city cycles, two highway cycles and two constant-speed cycles. All of it happens on a dynamometer in a laboratory.
The two laboratory ranges are then adjusted and weighted. EPA gives an example: an adjusted city range of 168 miles and an adjusted highway range of 140 miles produce a label value of 155 miles, from 0.55 x 168 plus 0.45 x 140. The label therefore leans slightly toward city driving, even on a car bought for long trips.
The highway cycle is not an interstate cruise
EPA’s detailed test information lists the highway cycle at an average 48.3 mph and a top speed of 60 mph. It lasts 12.75 minutes over 10.3 simulated miles and has no stops.
The separate high-speed cycle is more aggressive. Its top speed is 80 mph, its average is 48.4 mph, and it covers 8 simulated miles in 9.9 minutes with four stops. It is a short burst, not an hour at 80.
So the label’s highway portion represents free-flowing traffic at moderate speed. A 75 mph drive with a headwind, a roof box or a cold cabin sits outside that model.
The 0.7 factor does a lot of work
EPA says the adjusted values account for air conditioning, cold temperatures, high speed and aggressive driving. The most common approach is to multiply the laboratory result by 0.7. EPA’s own example turns a 200-mile laboratory highway result into 140 miles.
That factor is one allowance applied across very different conditions. It cannot tell you how much range a 20-degree morning, a 95-degree afternoon or a steady 80 mph will take. It only moves the estimate toward real use.
| Part of the label | What it uses | What it misses |
|---|---|---|
| City range | Stop-and-go cycle, 21.2 mph average, 23 stops | A long highway commute |
| Highway range | 48.3 mph average, 60 mph top speed, no stops | A 75 to 80 mph cruise |
| Adjustment | 0.7 factor for AC, cold, speed and aggression | Your actual weather and route |
| Weighting | 55% city plus 45% highway | A trip that is almost all highway |
| Published number | Combined range on the window sticker | The separate highway value |
Drag makes the gap grow with speed
FuelEconomy.gov’s factors page says driving at higher speeds increases aerodynamic drag and reduces fuel economy. It notes that the EPA tests account for drag up to 80 mph, but some drivers exceed that speed. The highway cycle’s 48.3 mph average is well below a 75 mph cruise, so faster running adds a load the cycle barely represents.
The speed and range guide works through the arithmetic. For this comparison, the direction is enough: the faster the cruise, the less the label’s highway portion represents it.
Other reasons the dashboard disagrees
Temperature is the next big variable. The label’s adjustment covers cold and AC in a general way, but a deep freeze or a heat wave can exceed it. How temperature affects EV range sets out the measured figures.
Elevation, wind, rain, tire pressure, tire model, payload and accessory use all change consumption. So does battery state. The label range assumes a full battery driven until depletion. A trip that starts at 80% and stops at 10% has less distance available between those points, even if consumption matches the test.
How to compare two EVs honestly
Use the combined label for the like-for-like comparison, because the label uses one defined calculation. Then ask what your own highway speed and climate will do. Look for a consumption figure in miles per kWh or kWh per 100 miles, and compare it at the speed you actually drive.
Read the window sticker for the exact trim, wheel size and battery. The EPA range versus real-world range guide covers the broader limits of the rating, and the Electric and Hybrid Vehicles hub has more ownership guides.
Frequently asked questions
Is highway range always lower than the EPA rating?
Not always at low speed, but often at interstate speed. The label’s highway cycle averages 48.3 mph and tops out at 60 mph, so a 75 mph cruise sits outside it. Cold, wind and elevation can widen the gap.
Why are city and highway weighted 55/45?
EPA weights adjusted city range at 55% and highway range at 45% to produce the combined label value. The result is one number for mixed use, not a separate highway rating.
Does the 0.7 adjustment apply to every EV?
EPA says automakers have optional approaches, but the 0.7 factor is the most common. A label may therefore include a different adjustment method. The number is an estimate either way.
Can I calculate my own highway range?
Use the car’s consumption display at a steady speed and divide the usable battery energy by that consumption. Repeat in similar weather. That gives a better route estimate than scaling the label by a fixed percentage.