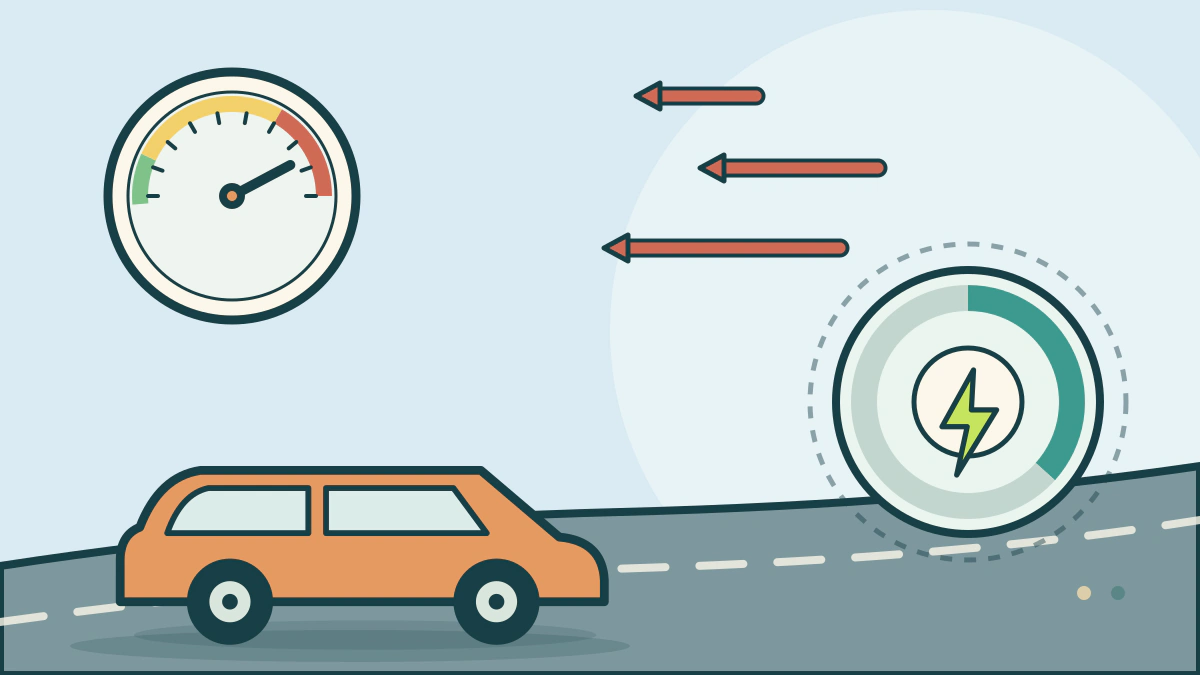
See why an EV uses more energy at highway speed, what the EPA test cycles actually run, and how to estimate the range cost of driving faster.
How much does speed change electric car range?
An electric car uses more energy per mile as steady speed rises, and the increase becomes steep on the highway because aerodynamic drag grows faster than speed. The penalty is small at low speed and large above roughly 50 to 60 mph, so a long interstate run can use far more energy than the same distance in town.
No single percentage applies to every EV. Shape, temperature, tires, load and wind all matter, so measure your own car.
Drag is why highway driving costs more
The Department of Energy’s Alternative Fuels Data Center says electric vehicles are more efficient in city driving than on the highway. City conditions have more stops, so regenerative braking recovers energy. Highway travel typically needs more energy to overcome the increased drag at higher speeds. [AFDC]
A NASA report on electric and hybrid vehicle aerodynamics states that aerodynamic forces are proportional to the square of velocity, and the power required to overcome drag is proportional to the cube. [NASA]
So energy per mile to push air aside rises with the square of speed, while the power needed at any moment rises with the cube. From 60 to 70 mph, a speed ratio of 1.167, drag energy per mile rises 36% and drag power rises 59%. From 60 to 80 mph, those figures are 78% and 137%.
| Speed change | Speed ratio | Drag energy per mile | Drag power |
|---|---|---|---|
| 60 to 65 mph | 1.083 | +17% | +27% |
| 60 to 70 mph | 1.167 | +36% | +59% |
| 60 to 75 mph | 1.250 | +56% | +95% |
| 60 to 80 mph | 1.333 | +78% | +137% |
Those numbers are arithmetic, not range tests. Rolling resistance, drivetrain losses and accessory loads also use energy, so the real change is smaller than the drag-only figures.
What the EPA highway test actually covers
The label range comes from laboratory cycles. EPA’s detailed test information lists the highway cycle at an average 48.3 mph and a top speed of 60 mph. The separate high-speed cycle reaches 80 mph, but it averages 48.4 mph and lasts 9.9 minutes over 8 simulated miles. [EPA]
So the highway rating is not a constant 75 mph test. A long drive at 75 or 80 mph goes beyond what the highway cycle represents, even though the label is adjusted for real-world factors.
EPA’s range testing page says the city and highway laboratory ranges are adjusted by a factor, most commonly 0.7, to account for air conditioning, cold temperatures, high speed and aggressive driving. [EPA] That is a broad allowance, not a route forecast.
The 50 mph turning point, and why the number is fuzzy
DOE’s Fact of the Week 1240 says fuel economy at 80 mph is about 27% lower than at 60 mph. It also reports that 40 to 50 mph was the optimum cruising speed in an Oak Ridge study of 74 light-duty vehicles. [DOE]
That study was mostly gasoline vehicles. FuelEconomy.gov warns that its speed estimates came from vehicles that included no electric cars, and that applicability to EVs is unknown. [FuelEconomy.gov] Use the direction, not the exact percentage.
On a steady highway run, regenerative braking has little to recover, and a faster cruise spends a larger share of battery energy on drag. [FuelEconomy.gov]
Other things that change the same-road result
Speed is not the only variable. A large roof-top cargo box can cut fuel economy by 10% to 25% at 65 to 75 mph because it adds drag. [FuelEconomy.gov] Wind also changes the drag the car works against. [NASA]
Cold also cuts range, whatever your speed: EV ownership in cold climates. Tread, pressure and wheel design also matter, as aftermarket wheels and EV range explains.
Turning speed into a trip decision
A 200-mile leg takes 3.33 hours at 60 mph and 2.86 hours at 70, a difference of about 29 minutes. At 80 mph it takes 2.5 hours, another 21 minutes faster than 70. But drag energy per mile from 70 to 80 rises about 31%.
If the faster run uses enough extra energy to force another charging stop, it can lose the time it saved. On a route with reliable chargers, the faster speed may still be the right choice. On a marginal leg, slowing down is often the cheaper way to keep a buffer.
Use the car’s consumption display, in miles per kWh or kWh per 100 miles, at a steady speed. Compare two runs on the same road in similar weather.
Follow the posted limit, and use cruise control where conditions allow; FuelEconomy.gov says it usually saves fuel. [FuelEconomy.gov]
Plan charging stops before the trip, not after the warning. See preparing an EV for a long road trip and EPA-rated range versus real-world range. The Electric and Hybrid Vehicles hub covers the wider ownership picture.
Frequently asked questions
Does driving slower always increase electric car range?
At a steady speed in mild conditions, yes, because drag falls sharply. Heater use, air conditioning, hills and wind still matter, so a slow freezing trip can use more energy per mile than a moderate spring trip.
Why is my EV less efficient on the highway than in the city?
City driving lets regenerative braking recover energy at each stop. Highway driving has few stops and more aerodynamic drag, so the same car uses more energy per mile.
Is 80 mph much worse than 70 mph for range?
It is worse, and the gap grows because drag rises with the square of speed. The exact change depends on the car. EPA’s high-speed cycle reaches 80 mph but lasts only 9.9 minutes, so it does not represent hours at that speed.
Does the EPA highway rating represent 70 mph driving?
No. The highway cycle averages 48.3 mph and tops out at 60 mph. A steady 70 mph drive is outside that cycle, even though the label includes a 0.7 adjustment for high speed and other factors.